The TerraQSARTM Advantage.
Linear versus non-linear relationshipsby
Klaus L.E. KaiserAll TerraQSARTM computation programs employ the "TerraQSAR Advantage". Very simply, the "TerraQSAR Advantage" recognizes and applies non-linear relationships between properties.
Over the last few decades, hundreds of useful quantitative structure- activity relationships (QSARs) have been developed. Their application resulted in the creation of new compounds, often with highly desirable biological activities. These classical QSAR methods are generally limited to highly focussed problems, involving structurally related substances. Typically, a basic chemical structure is modified by adding small substituents in a particular part of that structure and determining the resulting changes in biological activity. For many such series of compounds, the observed variation of the biological activity correlates well with the known electronic and/or steric influences of these substituents. Such correlations allow then the "in-silico" prediction of the effects of other, structurally similar compounds.
However, when it comes to the modelling of the effects of chemicals whose basic structure is quite dissimilar, the picture changes dramatically. The traditional QSARs cannot be used to model substances with different modes of action or, even those with the same mode when they have quite different basic skeletons. This condition of similarity is not only true for the biological effects of compounds, but also for their physico-chemical properties, such as the octanol/water partition coefficient (logP). In general, physico-chemical bulk parameters (such as the logP, as opposed to physico-chemical molecular parameters, such as e.g. molecular surface area) are often less affected by individual substituents on the molecule than their biological effects. Therefore, one might assume that the modelling of logP could successfully be achieved from a linear combination of atom and/or fragment values for all atoms or chemical fragments in the compound of interest. Unfortunately, this assumption holds true only for compounds of relatively simple complexity and with a comparatively small number of atoms, and so forth. Despite detailed studies of such atom, bond, and fragment values over the last fifty years or so, their application to the modelling of anything out of the ordinary points to severe problems with this approach, as is outlined further down.
Recognizing the importance of non-linear relationships, TerraBase Inc. has embarked on analyzing such non-linear dependencies for the development of highly effective non-linear, neural network-based models. The resulting computer programs, such as TerraQSARTM - LOGP [1], are able to predict biological effects and the octanol/water partition coefficient with a high degree of confidence over a wide range of compounds, and require neither low complexity nor similar structures. The following examples show comparisons of octanol/water partition coefficients (logP) calculated with TerraQSAR - LOGP, and a variety of other computer programs.
Most logP estimation programs, such as ACD-LOGP [2], CLOGP [3], KOWWIN [4], miLogP [5] or SCILOGP [6], use simple atom, bond and/or fragment counts in their linear prediction algorithms. In contrast, the TerraQSAR [1] programs go much further than that by analyzing the other dimensions of the chemicals under investigation. This may be illustrated on the example of some relatively simple compounds of the molecular formula C11H17N3O8, shown in Table 1.
Table 1. Computed octanol/water partition coefficients (CLOGPs) for four compounds of the sum formula C11H17N3O8, calculated by five programs, i.e. CLOGP (CLOGP), KOWWIN (KOWWIN), miLogP (MILOGP), SciLOGP (SCILOGP), and TerraQSAR - LOGP (TQ-LOGP), and the absolute maximum difference in estimated values for each compound (Delta-absoluteMAX-MIN).
SMILES CLOGP KOWWIN MILOGP SCILOGP TQ-LOGP Delta-absoluteMAX-MIN [C@@]23([H])[C@@]([C@]4([H])[C@]1([H])C(O)N=C
(N)N[C@@]1(C2O)C(O)[C@](O3)(O)O4)(CO)O-3.87 -7.10 -4.79 -2.24 -1.01 6.09 O=N(=O)C1=CC=C(N)C(=C1)NCOC(O)C(O)C(O)OCO -2.36 -3.53 -1.49 -2.13 +1.17 4.70 N1=C(O)C=C(O)C(=N1)C(CO)COC(O)C(O)C(O)OC(N)=O -3.35 -4.79 -2.65 +0.30 -0.82 5.09
As evident from Table 1 above, the predicted logP values for this small set of structurally diverse molecules are substantially different between the programs investigated. For the more complex compounds (i.e., those with specific 3D elements), they vary by several orders of magnitude between the linear programs alone.
One might think that a more homogenous series of compounds should provide closer agreement between these programs' estimations. Well, let's look at a simple series of aliphatic alcohols.
Table 2. Computed octanol/water partition coefficients (CLOGPs) for five aliphatic alcohols, computed by five programs, i.e. CLOGP (CLOGP), KOWWIN (KOWWIN), miLogP (MILOGP), SciLOGP (SCILOGP), and TerraQSAR - LOGP (TQ-LOGP), the absolute maximum difference in estimated values for each compound (Delta-absoluteMAX-MIN), and measured values; N/A: not available.
SMILES CLOGP KOWWIN MILOGP SCILOGP TQ-LOGP Delta-absoluteMAX-MIN Measured CO -0.76 -0.63 -0.27 -0.66 -0.75 0.49 -0.77 CCCCO 0.82 0.84 1.00 0.80 0.92 0.20 0.88 CCCCCCCCCCO 4.00 3.79 3.61 4.07 4.25 0.54 4.57 CCCCCCCCCCCCCCCCCCCCCCCCCCCCCCO 14.58 13.61 10.83 8.57 10.11 6.01 N/A CCCCCCCCCCCCCCCCCCCCCCCCCCCCCC
CCCCCCCCCCCCCCCCCCCCCCCCCCCCCCO30.45 28.34 12.73 6.52 7.36 23.93 N/A
As can be seen from Table 2, above, for this series of n-alcohols, the variation of the estimates obtained with these programs is even larger. While there is close agreement on the the C1, C4, and C10 alcohols, for the C30-alcohol, the maximum variation (column DELTA MAX-MIN) is already six orders of magnitude and for the C60-alcohol an astounding 23.9 orders of magnitude!
This kind of divergence, however, is not limited to aliphatic compounds. A set of "aromatic" compounds is given in Table 3 with a series of 4-tert-butylphenol ethoxylates.
Table 3. Computed octanol/water partition coefficients (CLOGPs) for a series of four 4-tert-butylphenol ethoxylates, calculated by five programs, i.e. CLOGP (CLOGP), KOWWIN (KOWWIN), miLogP (MILOGP), SciLOGP (SCILOGP), and TerraQSAR - LOGP (TQ-LOGP), and the absolute maximum difference in estimated values for each compound (Delta-absoluteMAX-MIN).
SMILES CLOGP KOWWIN MILOGP SCILOGP TQ-LOGP Delta-absoluteMAX-MIN c1cc(C(C)(C)C)ccc1OCCO 3.01 3.01 2.81 3.47 4.10 1.29 c1cc(C(C)(C)C)ccc1OCCOCCOCCOCCOCCO 2.67 1.91 2.52 2.40 4.02 2.11 c1cc(C(C)(C)C)ccc1OCCOCCOCCOCCOCCOCCO 2.54 1.64 2.44 2.20 4.27 2.63 c1cc(C(C)(C)C)ccc1OCCOCCOCCOCCOCCOCCOCC
OCCOCCOCCOCCOCCOCCOCCOCCOCCOCCOCCO+0.91 -1.66 +1.55 +1.82 +3.31 4.97
As evident from the examples given in Tables 1-3, the values provided by various logP estimation programs are generally in close agreement for low molecular weight, relatively simple molecules. As soon as the input structures become more complex or uncommon, the predictions start to diverge severely, resulting in some quixotic estimates with logP values of 20 or 30. The providers of the CLOGP estimates are to be lauded for at least admitting that such estimates are "unrealistic in nature".
Nevertheless, these programs produce such numbers, and there are many users of such programs who are not trained in the field and whose preference is to get "a number", i.e. any number, not realizing how wrong it could be.
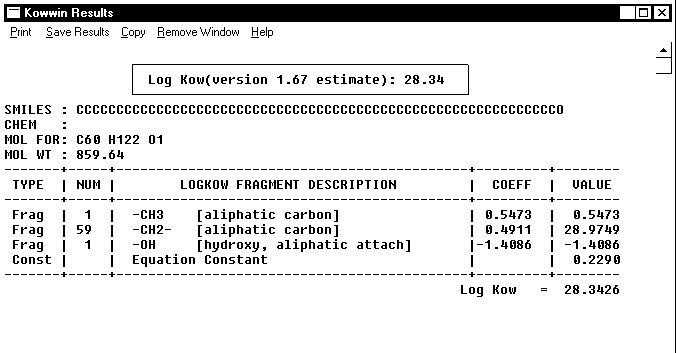
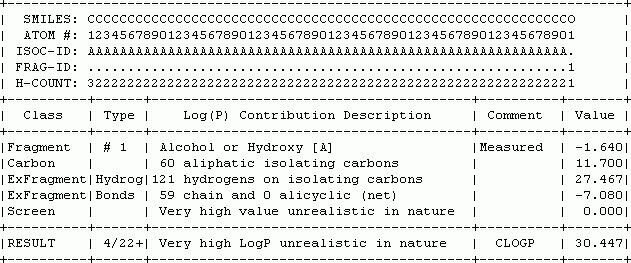
Linear methodologies use bond and fragment values derived from relatively simple chemical structures and multiply such values by the number of occurrences in any compound to be estimated. This is shown on the example of the KOWWIN and CLOGP computations for compound 4 in Table 2, see Figures 1 and 2, below.

Figure 1. KOWWIN calculation of logP for compound 4 in Table 2.
The corresponding CLOGP calculation for the same compound is shown in Figure 2.

Figure 2. CLOGP calculation of logP for compound 4 in Table 2.
Examination of the examples given in the tables and figures above provides some insight into the reasons for the failure of such linear programs to provide meaningful estimates for compounds out of the realm of the ordinary, that is other than simple low molecular weight structures. From an environmental and health point of view, the types of compounds used in the examples above are certainly of concern and interest. For example, polyethoxylates with up to one hundred ethoxy (SMILES "CCO") fragments are used in certain detergents [1]. Any program which is built on the assumption of partition coefficients being a linear function of simple numeric counts of atoms, bonds, or fragments, is bound to fail at one point. However, the magnitude of divergence between some of the values is truly surprising. Even for low molecular weight structures, the variation between low and high estimates can be several orders of magnitude. For the long-chain alcohol (compound 5 in Table 2), the values differ by nearly astronomical proportions, namely 23+ orders of magnitude. For the series of polyethoxylates, the range is much smaller, namely one to five orders of magnitude for the compounds with one and twenty ethoxy units, respectively.
At least two of the widely used octanol/water estimation programs, i.e. CLOGP and KOWWIN, work on the principle of perpetual linearity, i.e., all relationships are linear, ad infinitum.
The real problem with linear methodologies is their basic premise, namely the assumption that reliable estimates can be made for all compounds from atom and fragment values derived from small structures of low-complexity using linear algorithms. This is simply not the case, and the reasons are manyfold. For one, the linear methods do not account for three-dimensional effects (although some programs have "correction factors"). For example, the binding affinity of 17beta-estradiol to the estrogen receptor is known to be approximately two orders of magnitude greater than that of 17alpha-estradiol. The TerraQSAR - E2-RBA [8] program recognizes this difference in the stereochemistry and uses such information in its prediction algorithm. Another type of stereochemical effect is the folding of longer aliphatic chains, resulting in much shorter "effective" chains, than the chemical structures would indicate. This has strong ramifications when trying to predict octanol/water partition coefficients from linear models. In contrast to the linear methodologies, the TerraQSAR - LOGP program recognizes such "effective" molecular conformations and computes the octanol/water partition coefficient accordingly. A third type of problem is the assumption that substituents do not affect each other and/or their combined effect on the molecule's properties (although some programs have "correction factors" more numerous than their algorithms).
Another "selling point" for some of the programs using linear methodologies is the speed of computation. Indeed, such linear relationship-based estimation programs are quite fast, being able to compute logP for 100,000 compounds in one or two hours. This apparent benefit though must be weighed against the reliability of the results. Computing with great speed is only worth computing if the values are useful. For the interested reader, other comparative results from several logP programs, some including TerraQSAR - LOGP, using identical input and showing measured values (where available) can be found on this web site (e.g., Liverpool-examples-data , Antipsoriatics), and elsewhere in the literature (e.g., [9]).
Some of the problematic logP estimates derived from linear programs have ramifications well beyond the octanol/water partition coefficient itself. Other computational programs, such as WSKOWNT [4], which calculates the water solubility of compounds on the basis of linearly computed logP values provides erroneous values many orders of magnitude from measured values. For example, the insecticide Fenbutatin oxide (CAS 13356-08-6) has a measured water solubility value of 0.005 to 0.01 mg/L. For this compound, the KOWWIN program produces a logP estimate of 13.63 and (on the basis of that) a water solubility estimate of 0.000000000000325 mg/L, i.e. approximately 10 orders of magnitude different.
In summary, when making one's own judgement of these programs and their computed data, the reader should be mindful of the Hungarian proverb:
The believer is happy; the doubter is wise.
References
[1] TerraBase Inc., 2004; TerraQSAR - LOGP; http://www.terrabase-inc.com.
[2] Advanced Chemistry Development, 2004; ACD/LogP; http://www.acdlabs.com.
[3] Daylight Chemical Information Systems, Inc., 2004; CLOGP; http://www.daylight.com.
[4] U.S. Environmental Protection Agency, 2004; KOWWIN; http://www.epa.gov/opptintr/exposure/docs/episuite.htm.
[5] Molinspiration Cheminformatics, 2004; miLOGP; http://www.molinspiration.com.
[6] Interactive Analysis, 2004; logP; http://www.logp.com.
[7] van Os NM, Haak JR, Rupert LAM, 1993; Physico-Chemical Properties of Selected Anionic, Cationic and Nonionic Surfactants. Elsevier, Amsterdam.
[8] TerraBase Inc., 2004; TerraQSAR - E2-RBA; http://www.terrabase-inc.com.
[9] Vrakas D, Tsantili-Kakoulidou A, Hadjipavlou-Litina D, 2003; Exploring the consistency of logP estimation for substituted coumarins. QSAR & Combin. Sci., 22: 622-629.